Automated weekly report
Receive the revenue, refunds, customer activity, and comparisons your team needs without preparing another spreadsheet.
Automated Stripe reporting
I build automated Stripe dashboards and weekly revenue reports that show revenue, refunds, failed payments, subscriptions, and customer activity in one clear view.
Reporting can be read-only. Your checkout and payment flow stay intact.
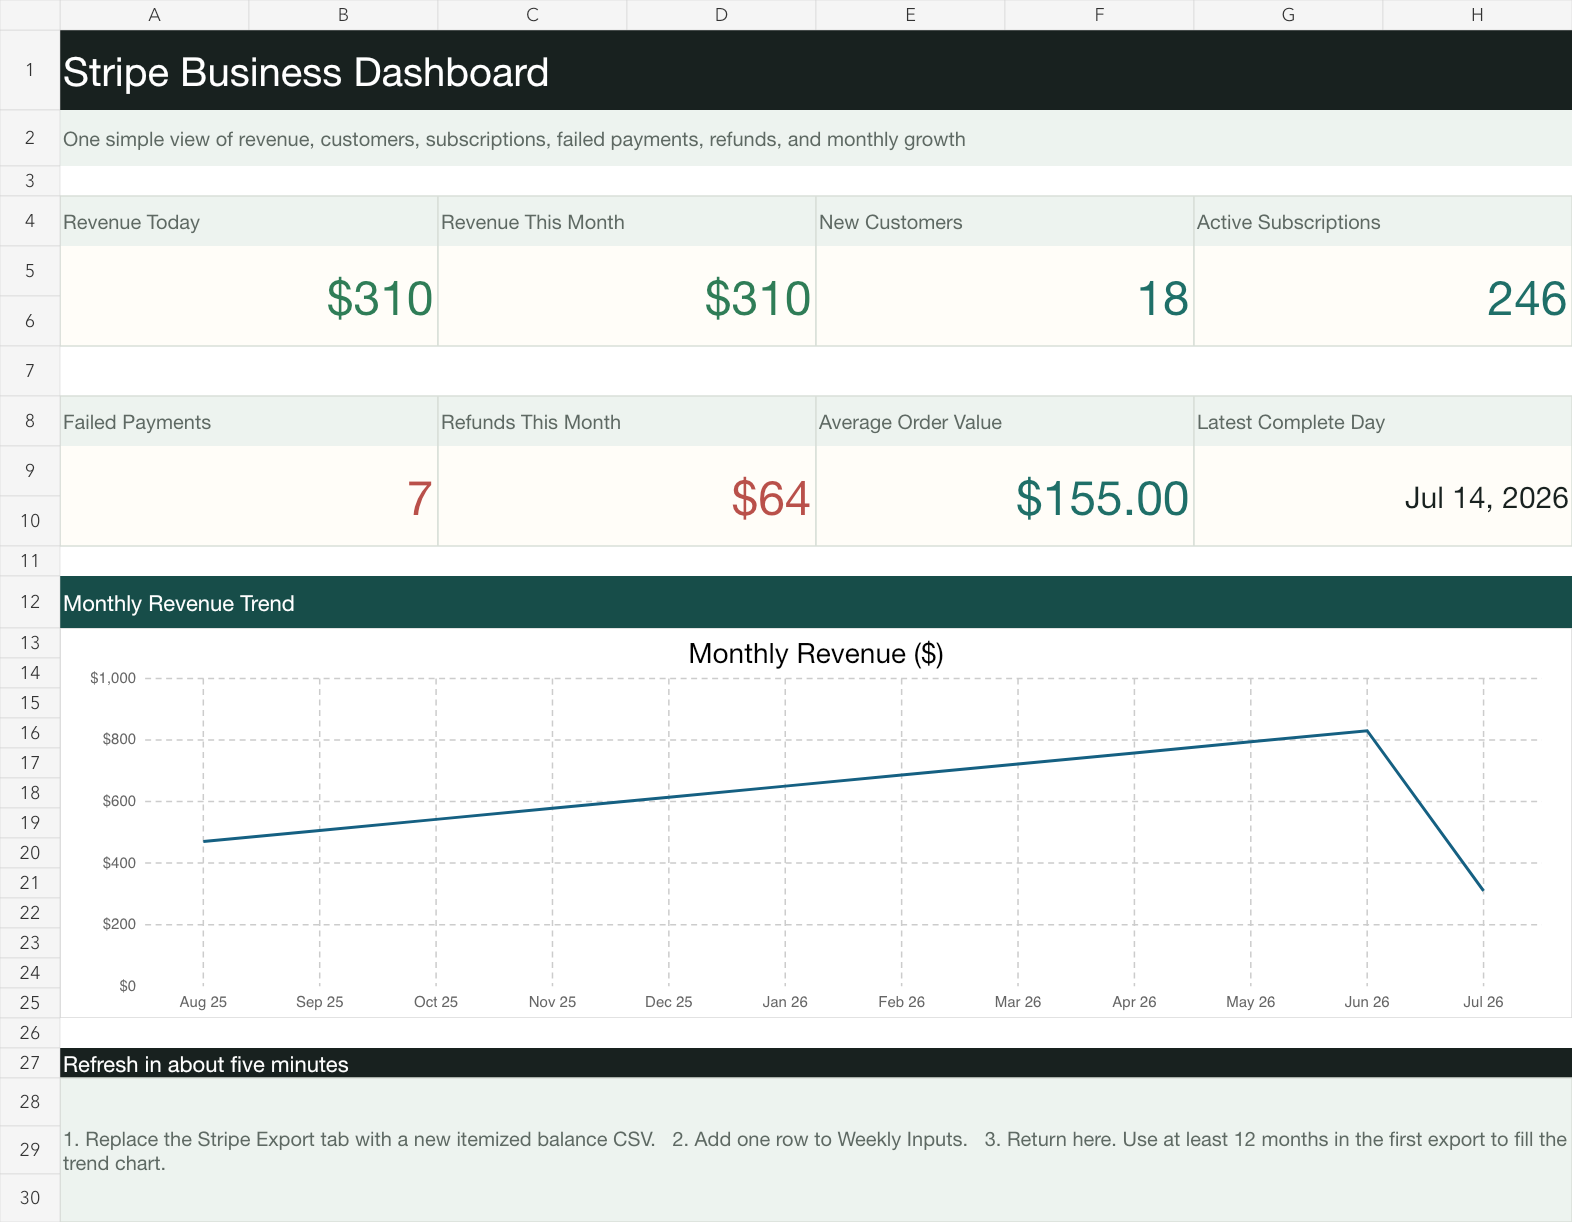
Know what changedRevenue and trends without exports
See what needs attentionFailed payments, refunds, and risk
Share one clear reportOwners and managers see the same numbers
The real problem
The important numbers are in Stripe, but owners often still export files, calculate comparisons, check failed payments, and assemble updates by hand.
Before
After
What you get
The first version focuses on the few numbers that change what you do next. More systems and reporting can be added when they have a clear purpose.
Receive the revenue, refunds, customer activity, and comparisons your team needs without preparing another spreadsheet.
See current Stripe performance in one clear view instead of opening exports and calculating totals.
Surface failed payments, refunds, disputes, and other issues that deserve attention.
Track active subscriptions, recurring revenue, cancellations, and retention when those numbers matter to your model.
Understand which customers, products, or plans are driving revenue and how that changes over time.
Combine Stripe with Google Sheets, accounting data, forms, or internal systems when revenue needs more context.
Relevant proof
For a guitar membership business, I connected subscriptions, donations, digital products, content, and the admin workflow behind them in one custom platform.
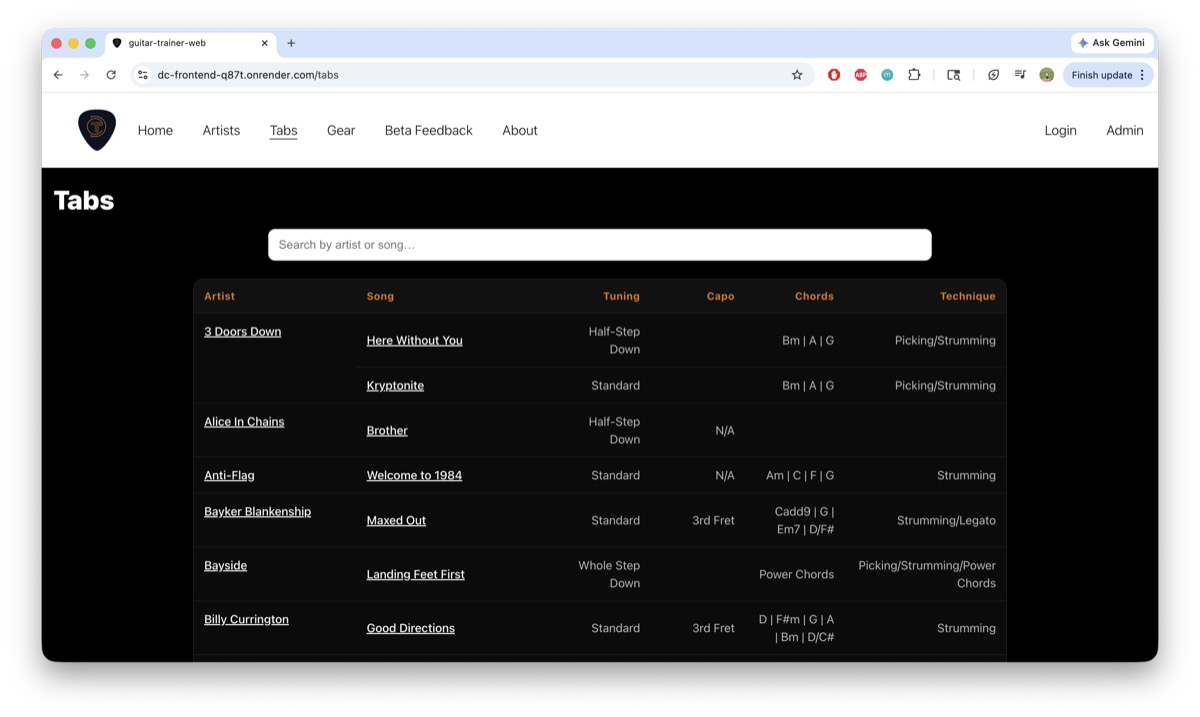
“Ravert Systems provided a solution and now I can focus on what matters.”
One workflowSubscriptions, donations, and content access
Less admin workOne-click publishing and consistent organization
Better customer experienceSimpler paid membership and product flows
Free Stripe reporting assessment
In a short call, we'll review the numbers you check today, who needs them, and where manual reporting is costing time or hiding important changes.
No obligation. Just a clear first step toward useful reporting.
FAQ
No. Reporting can be connected with read-only access. Your checkout, subscriptions, and customer payment experience can continue working as they do today.
Yes. The dashboard can be designed around one-time sales, subscriptions, or a mix of both.
Yes. Stripe can be combined with spreadsheets or other business systems when those sources are needed to explain revenue, customers, costs, or fulfillment.
Yes. Historical reporting can show week-over-week, month-over-month, and longer-term changes when enough Stripe history is available.
It depends on the number of metrics, reporting frequency, historical data, and other systems involved. The free assessment identifies the smallest useful version before any project is proposed.