Stripe has the numbers. They are just spread across different pages.
Many business owners use Stripe every day.
But checking the health of the business often looks like this:
The information exists. It is just scattered.
The goal is not to replace Stripe. The goal is to answer one simple question: How is my business doing today?
The daily view
The 8 metrics worth checking
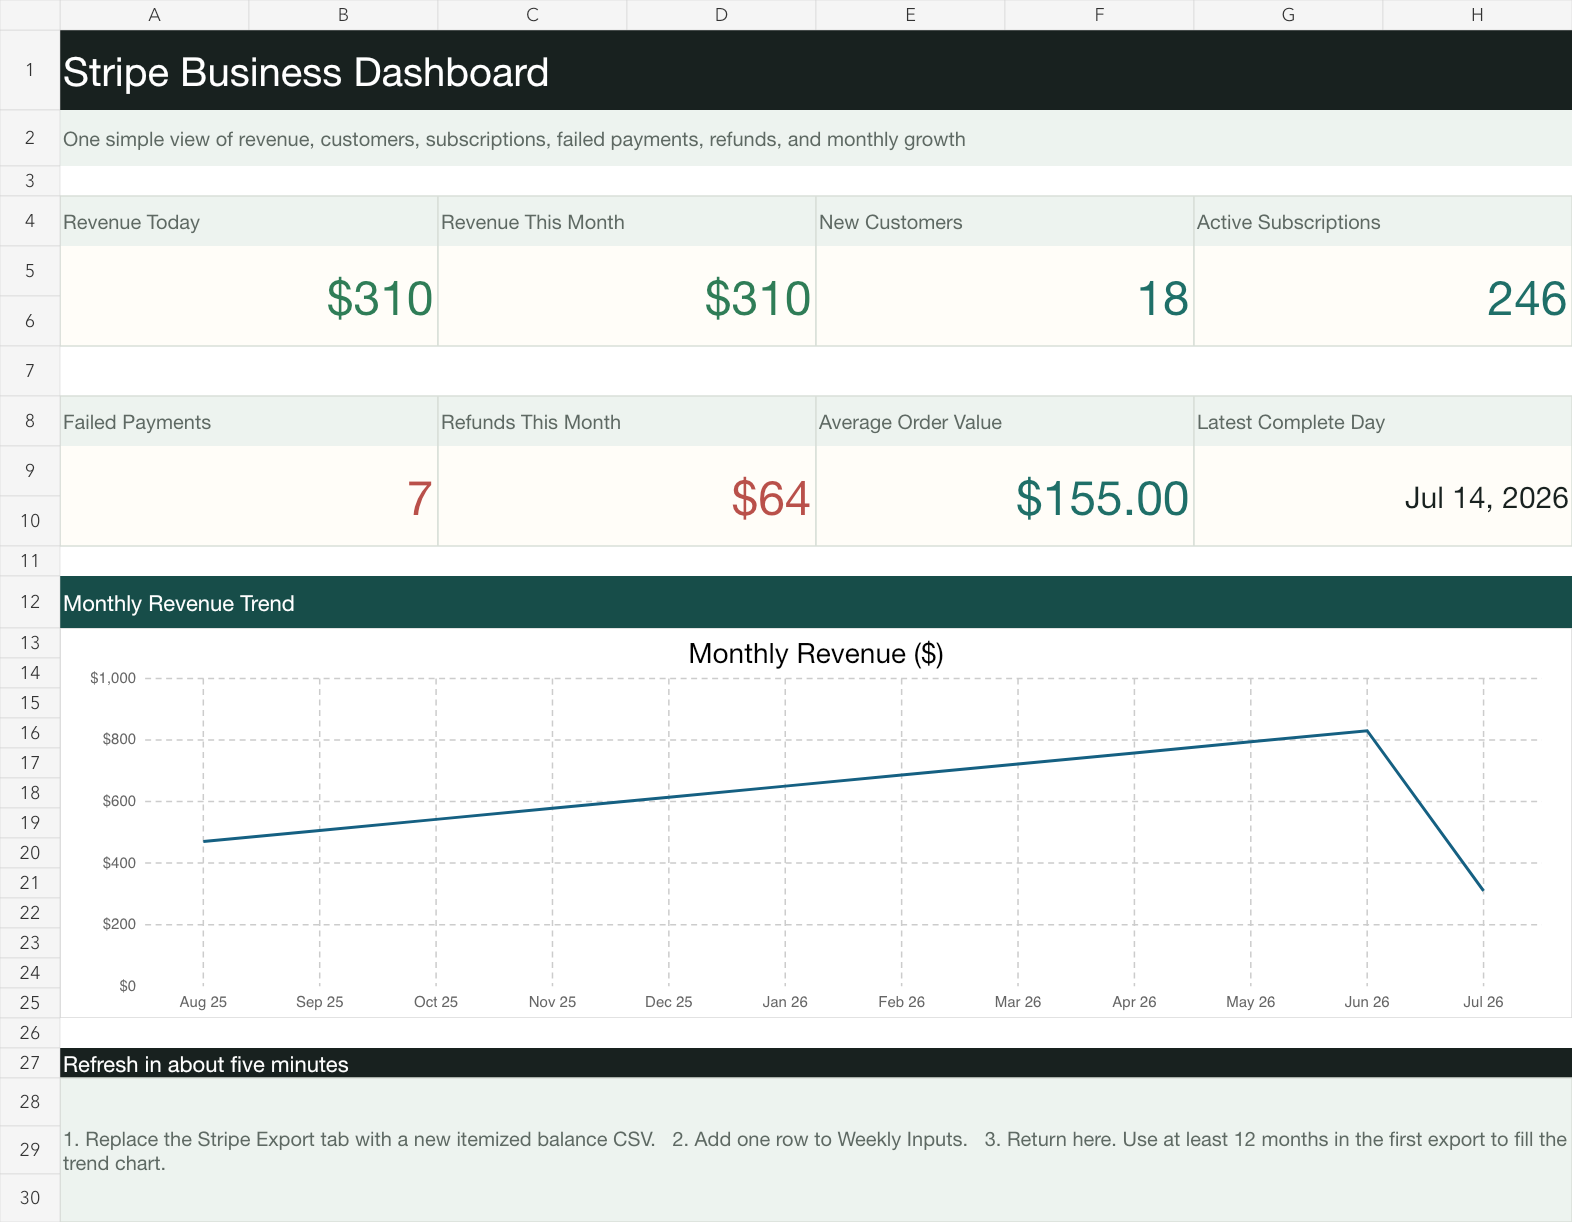
Revenue Today
A quick pulse on the newest complete day in your Stripe report. It helps you notice a strong or unusually slow day.
Revenue This Month
Your month-to-date sales total makes it easier to compare progress with last month and your goals.
New Customers
New customer growth shows whether more people are choosing your business, not just whether existing customers are paying again.
Active Subscriptions
For a recurring business, this is one of the clearest signs of stable future revenue.
Failed Payments
A failed payment may mean a good customer simply needs help updating a card. Catching it early can protect revenue.
Refunds
One refund is normal. A rising pattern may point to a product, service, or customer-expectation problem.
Average Order Value
This shows how much a customer spends in a typical order. It helps you see whether packages and add-ons are working.
Monthly Revenue Trend
A simple line chart makes growth, slow months, and seasonal patterns much easier to spot.
Final result
One dashboard instead of five pages
The free template puts the newest numbers and the monthly trend in one place. The spreadsheet does the math for you.
Free dashboard
Start with the ready-made template
It includes the formulas, monthly chart, Stripe Export tab, and Weekly Inputs tab. Upload it to Google Drive and open it with Google Sheets.
The beginner version
Build your dashboard today
You do not need coding experience. The first setup takes about 20 to 30 minutes. After that, the weekly update takes about five.
1. Download and open the template
5 minutesDownload the template above. Upload it to Google Drive. Choose Open with Google Sheets. You will see Dashboard, Stripe Export, and Weekly Inputs tabs.
2. Open the Stripe Balance report
3 minutesSign in to Stripe. Open Reports, then open the Balance report. Find the section named Balance change from activity.
Stripe's official Balance report guide shows the same report and download area.
3. Download the itemized CSV
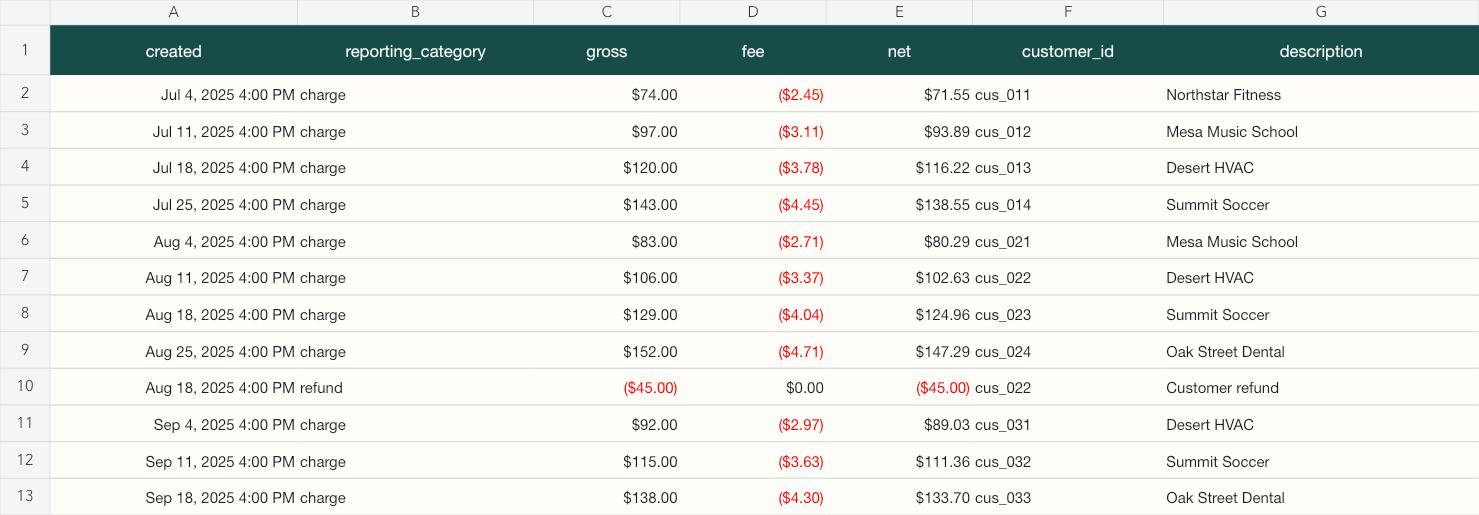
5 minutesChoose a date range. Use the last 12 months the first time so the trend chart has history. Click Download in the Balance change from activity section. Choose Itemized and CSV.
Select these columns in this order:
- created
- reporting_category
- gross
- fee
- net
- customer_id
- description
Those names may look a little odd. You only need to select them once. The template knows what to do with them.
4. Import the CSV into Google Sheets
3 minutesOpen the Stripe Export tab first. Then choose:
5. Add three quick weekly numbers
2 minutesOne financial export cannot include every number from every Stripe page. Open the Weekly Inputs tab and add:
- New customers
- Active subscriptions
- Failed payments
Copy those three numbers from Stripe. This keeps the beginner setup simple and makes all eight dashboard metrics useful.
6. Open the Dashboard tab
InstantRevenue, refunds, average order value, customer growth, subscriptions, failed payments, and the monthly chart are ready.
Start simple
You don't need perfect automation
Many businesses spend months looking for the perfect dashboard. Spending five minutes each week updating one spreadsheet is already a huge improvement over clicking through several reports.
Start simple. You can always automate it later.
What happens as the business grows?
Eventually, most owners do not want to export a CSV every week. They want the dashboard to stay ready on its own.
That is when automation becomes valuable.
The advanced version
The dashboard updates automatically
Payments, subscriptions, refunds, and customer records flow into one secure dashboard. The history stays available without a weekly import.
What changes after automation?
- Every payment appears automatically
- Subscription counts stay current
- Refunds and failed payments update automatically
- Charts always use the newest data
- Historical records stay available
- Optional email reports arrive on schedule
- Multiple users can have the right level of access
- Multiple Stripe businesses or locations can share one view
What Ravert Systems builds
A Stripe dashboard built around your business
You do not need to plan the technical work. We handle the secure connection, the automatic sync, and the dashboard itself.
- A secure Stripe connection
- Automatic payment and subscription syncing
- A custom dashboard and charts
- Historical trend reporting
- Google Sheets and CSV exports
- Scheduled email summaries
- Future connections to QuickBooks, Shopify, Google Business, Google Calendar, or other tools
Simple or automated?
| Comparison | Simple dashboard | Automated dashboard |
|---|---|---|
| Cost | Free | Custom project |
| Weekly work | About five minutes | No manual update |
| Data refresh | Replace a CSV | Updates automatically |
| Main view | Google Sheets | Custom dashboard |
| Best fit | Getting started | Growing businesses |
| Other systems | Stripe only | Stripe plus your other tools |
Ready for the next step?
Ready to stop manually checking Stripe?
If you have outgrown CSV exports, Ravert Systems can build a dashboard that updates automatically and connects Stripe with the rest of the software you already use.
- Connect Stripe
- Build custom reports
- Track historical trends
- Combine Stripe with other business systems
- Export data whenever you need it